
In earlier articles in this series, we have discussed the various functions within any business that can contribute to sound equipment reliability (design, operations, maintenance and supply). In this article we will discuss some of the key tools and techniques that can be used by these functions, and where these may be applicable. Due to space constraints, we will not be discussing these techniques in detail, but where appropriate, links have been included in this article to other articles that we have written for those that require more information.
While there are many techniques that we could discuss, we will focus on those that are most widely used and which are generally seen as being those of most value. These are:
- Reliability Modelling
- Failure Modes and Effects Analysis (FMEA) and Failure Modes and Criticality Analysis (FMECA)
- Reliability Centered Maintenance (RCM) and PM Optimisation (PMO)
- Root Cause Analysis
In our next article, we will discuss an additional tool that is rapidly gain traction in industry – the use of Predictive Analytics and Machine Learning as a tool not just to predict equipment failure, but also to extend the Mean Time Between Failures.
This is the sixth article in a series of eight articles on Reliability Improvement. The other articles in this series include:
Articles in this series
Reliability Modelling
Reliability Modelling is a success-oriented network drawing and calculation tool used to model specific functions of complex systems by using a series of images (blocks). When used to model a system, each component within the system is represented by a block and the connections between the blocks are used to indicate that each component is properly performing its intended function. If a connection exists between the two end points of the diagram, it is said that the system is performing its intended function or that some specified failure mode is not occurring.
Reliability Modelling can be used to:
- Assist in selecting design alternatives with high dependability,
- Evaluate and quantify the reliability of alternative designs and configurations,
- Test and quantify the impact on overall system reliability of making changes to the reliability of one component within that system,
- Provide quantitative information for other analysis techniques such as Reliability Centered Maintenance and Event Tree Analysis.
The following is an example of a simple high-level reliability model developed for a dump station:
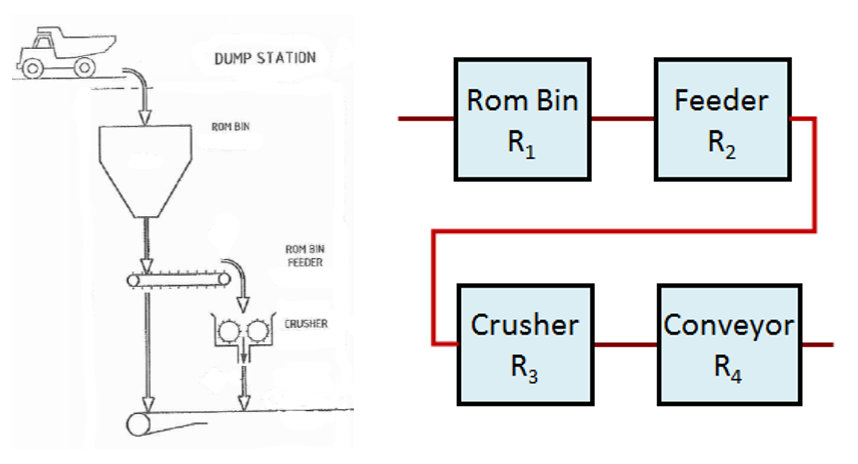
Once the blocks are configured in the proper form, the hazard rate (instantaneous failure rate), mean time between failures (MTBF), mean time to repair (MTTR), reliability, and availability of the system can be calculated based upon underlying statistical distributions (the probability density function [pdf]) that model the items’ failure behaviour. Some commonly used probability distributions, and the key parameters required for each of these include:
- Exponential – failure rate λ
- Normal – mean μ and standard deviation σ
- Lognormal – mean μ and standard deviation σ
- Weibull – shape parameter β and scale parameter or characteristic life η
The source of the parameters and/or the assumptions made with the distributions parameters need to be made and documented. Without good data, this will be difficult to achieve. For example, what is the MTBF (1/failure rate λ) for an electric motor? One of the keys to successful reliability modelling is to understand which distribution is most applicable in any given situation, and this requires experience and a solid understanding of reliability and statistics.
In using these distributions, the mathematics can become quite complicated when dealing with a complex system comprised of multiple arrangements of series, parallel, k-out-of-n etc systems. Therefore, programs such as Microsoft Excel or specialty modelling programs can be used to develop reliability models. In all cases, the underlying parameters need to be obtained for each of the distributions. Parameters for these distributions include:
The source of the parameters and/or the assumptions made with the distributions parameters need to be made and documented. Without good data, this will be difficult to achieve. For example, what is the MTBF (1/failure rate λ) for an electric motor?
The model is only as good as the underlying data and assumptions used to support the model, and obtaining sufficient, good quality data, is often the biggest limitation in developing robust, defensible conclusions from Reliability Models.
Failure Modes and Effect Analysis (FMEA) and Failure Modes and Criticality Analysis (FMECA)
Failure Modes and Effects Analysis (FMEA) is used to identify the ways in which components, systems or processes can fail to fulfil their design intent and identifies:
- All potential failure modes of the various parts of a system,
- The effects these failures may have on the system,
- The mechanisms of failure, and
- How to avoid the failures, and/or mitigate the effects of the failures on the system.
Failure Modes, Effects and Criticality Analysis (FMECA) extends an FMEA so that each fault mode identified is ranked according to its importance or criticality.
FMEA/FMECA can be used to:
- Assist in selecting design alternatives with high dependability,
- Ensure that all failure modes of systems and processes, and their effects on operational success have been considered,
- Identify human error modes and effects,
- Provide a basis for planning testing and maintenance of physical systems,
- Improve the design of procedures and processes,
- Provide qualitative or quantitative information for other analysis techniques such as Reliability Centered Maintenance and Fault Tree Analysis.
There are a number of standards available for the conduct of FMEA/FMECA:
- IEC 60812, Analysis techniques for system reliability – Procedures for failure mode and effect analysis (FMEA)
- MIL-STD-1629A Procedures for Performing a Failure Mode, Effects, and Criticality Analysis
- SAE J1739 Potential Failure Mode and Effects Analysis in Design (Design FMEA) and Potential Failure Mode and Effects Analysis in Manufacturing and Assembly Processes (Process FMEA) and Effects Analysis for Machinery (Machinery FMEA)
The steps in performing FMEA are as follows:
- Define boundaries around the system to be analysed
- Identify Functions of each asset/component.
- Identify Functional Failures of each asset/component.
- Identify Failure Modes and Causes of each asset/component.
- Describe Failure Effects of each asset/component. Effects can be described at three levels:
- Local Effect. These are the effects local to the failure mode on the asset being analysed.
- Next Higher Effect. These are the effects on the system of which the asset forms a part.
- End Effect. These are the end effects to the business of the asset failure.
- Describe Failure Detection Methods of each asset/component.
- Identify inherent provisions in the design to compensate for the failure
For FMECA, the next step is to perform a criticality assessment which classifies each of the identified failure modes according to its criticality by assessing failure consequences and likelihood of each asset/component. Several methods are available including:
- Mode criticality index
- Level of risk
- Risk priority number (RPN)
FMEA and FMECA of themselves are of value only to the extent that they lead to effective decisions regarding equipment or system design or maintenance. Performing FMEA and FMECA provides insights regarding possible failure modes to be addressed in the design or maintenance of equipment, but they do not provide formal methodologies for addressing the identified failure modes.
Reliability Centered Maintenance (RCM) and PM Optimisation (PMO)
Reliability Centered Maintenance (RCM) is used to develop an applicable and effective preventive maintenance program for equipment in accordance with the safety, environmental, operational and economic consequences of identifiable failures and the degradation mechanism responsible for those failures.
RCM incorporates use of FMEA/FMECA as the first part of the RCM process.
There are a number of standards and texts available for the conduct of RCM:
- SAE JA1011, Evaluation Criteria for RCM Processes – defines what are the fundamental steps for any process to be called RCM
- IEC 60300-3-11 Dependability management – Part 3-11: Application guide – Reliability centered maintenance
- SAE JA1012, A Guide to the Reliability-Centered Maintenance (RCM)
- Moubray, John. Reliability-Centered Maintenance II, Industrial Press. New York, NY. 1997. ISBN 978-0-8311-3146-3
- MSG-3. Maintenance Program Development Document. Air Transport Association, Washington, D.C. Revision 2, 1993.
- MIL-STD-3034 Department of Defense Standard Practice: Reliability-Centered Maintenance (RCM) Process
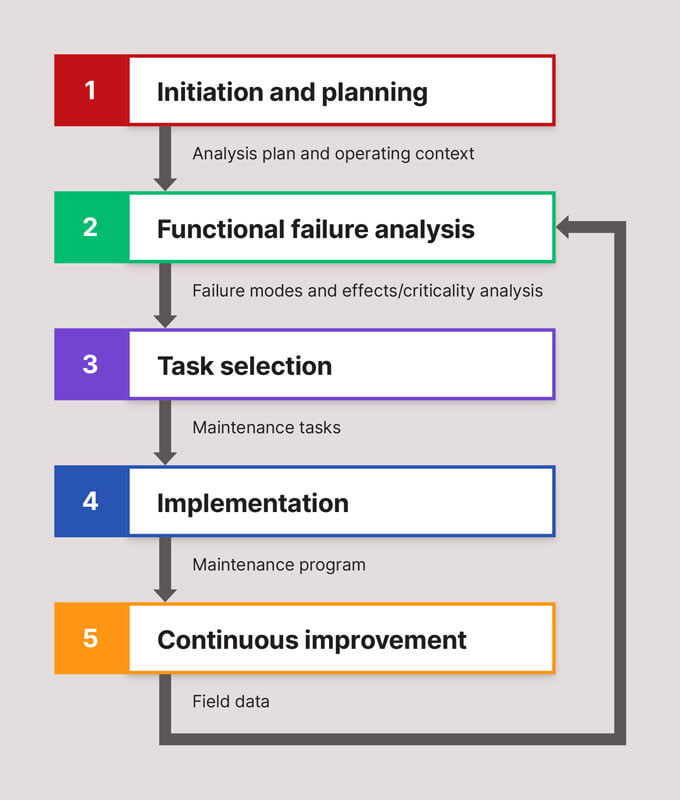
There are five phases involved in implementing an RCM program as shown in the diagram below.
For any process to be called RCM, the minimum criteria are that the following seven questions are answered:
- What are the functions of the asset? (Functions)
- In what ways can it fail to fulfil those functions? (Functional Failures)
- What are the causes of those failures? (Failure Modes)
- What are the effects of those failures? (Failure Effects)
- In what way does the failure matter? (Failure Consequences)
- What should be done to predict or prevent the failure from occurring? (Preventive and Predictive Tasks)
- What should be done if the failure cannot be predicted or prevented through maintenance? (Default Actions)
The first four steps are the FMEA/FMECA process which we described earlier. The remaining steps involve making decisions around the maintenance tasks that need to be performed. Each task must be both Applicable and Effective.
A task is Applicable if, from a technical perspective, it successfully predicts, prevents or detects the failure mode. It is Effective if, from a business perspective, it deals successfully with the consequences of the failure.
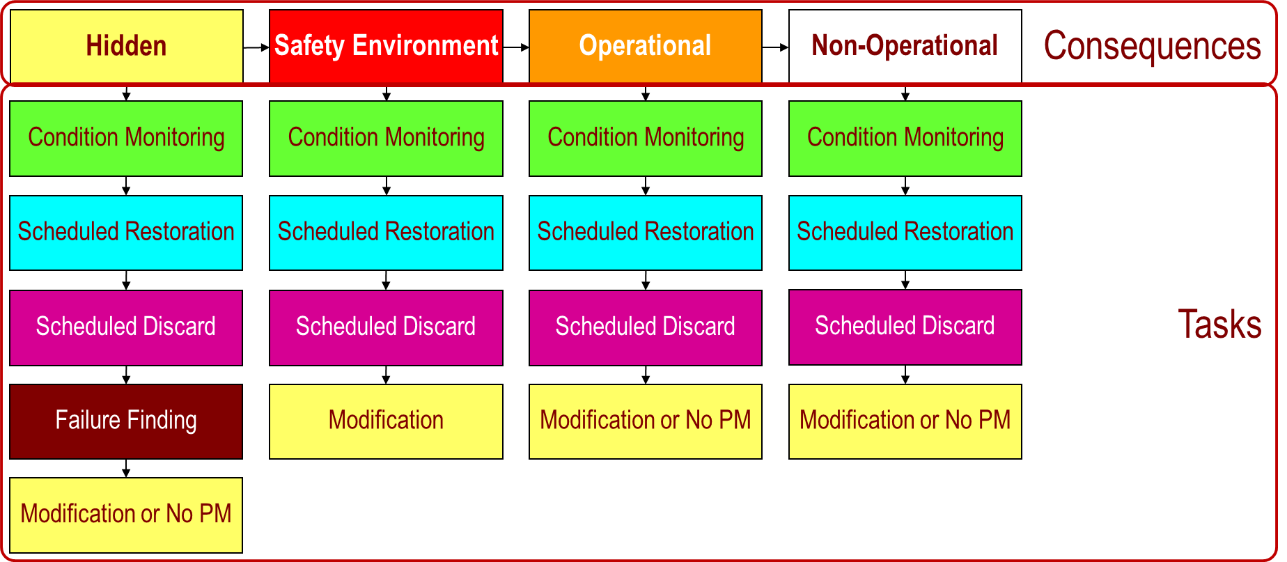
Typically, a structured decision process is followed in deciding on suitable maintenance tasks, often using a decision diagram similar to the following:
RCM is a semi-quantitative approach to maintenance task development. In general, the information required for effective decision-making in most organisations is typically not captured in formal information systems, and so it tends to rely (to a greater or lesser extent) on input from those familiar with the operation and maintenance of the equipment during its application. This can tend to be time and resource-intensive, and for these reasons in many industries, RCM is used sparingly, most often when dealing with highly critical equipment.
PM Optimisation (PMO)
PM Optimisation (PMO), like RCM, is used to develop an applicable and effective preventive maintenance program for equipment. Unlike RCM, there are no formal international standards for PMO, and so the approach taken may vary from vendor to vendor.
In our approach, PMO uses the same decision-making process as that used in RCM, but differs in the way that failure modes are identified for analysis. Instead of using a FMEA process to identify failure modes, instead the first four questions of the RCM process are replaced by the following questions:
- Current PM tasks – what are the current PM tasks being performed?
- Failure Modes – what failure modes are these addressing?
- In-service Failures – what in-service failures are currently being experienced, and what are their causes?
- Hidden Failures – what protective devices and systems are in place and what are the potential failure modes associated with these?
The answers to these questions are then used to develop the failure modes used for decision-making. In practice, this approach is typically quicker (especially for existing assets with mature preventive maintenance programs already in place), as the answers to these questions can be more easily answered, and the resulting failure modes are more likely to be those commonly experienced in practice (unlike in an FMEA process, where some failure modes identified may rarely or never, in practice, be experienced). Because a smaller number of failure modes are identified, then the decision-making process can also be performed more quickly.
While the process is quicker, in most applications, there is no loss of quality in outcomes, so long as appropriate rigour is applied in identifying the failure modes. However, there is a slight chance that some extremely rare failure modes may be missed when using the PMO process. If this is concerning to you, then the RCM process may be better for you than PMO.
Like RCM, PMO is also a semi-quantitative approach to maintenance task development, and relies on input from those familiar with the operation and maintenance of the equipment. However, because it is quicker to apply, it tends to be less resource-intensive when applying this process.
Root Cause Analysis (RCA)
Root cause analysis (RCA) is a method of problem solving used for:
- Identifying the root causes of faults or problems instead of dealing only with the immediately obvious symptoms
- Developing and implementing solutions that prevent occurrence/recurrence of the fault or problem
The process involves the use of structured analysis techniques such as: ‘5 whys’ , FMEA, FTA, Fishbone diagrams, Pareto analysis, cause and effect mapping.
Focusing on the identification and elimination of the causes of equipment failure assists with:
- Maximising Equipment Uptime and Throughput
- Reducing the risk of future Safety and Environmental incidents
- Maximising the proportion of planned maintenance work
- Minimising Maintenance Costs
The following are the steps involved with performing a RCA.
Step 1: Prepare for the Analysis
- Define the Problem
- Preserve and Collect Data
- Minimise Further Consequences
- Arrange the Analysis Team
Step 2: Perform the Analysis
- Identify the Causes. There are typically three types of causes that can contribute to a problem/failure:
- Physical Causes. Tangible, or component level causes.
- Human Causes. Intended or unintended errors made by people.
- Organisational/System Causes. The organisation’s processes, procedures, systems and culture. Addressing these causes is most likely to lead to long-term, sustainable change.
- Establish relationships between Causes and Effects.
- Verify Hypotheses and Validate Causes
- Develop Solutions
Step 3: Implement the Recommended Solution(s)
- Obtain Approvals
- Assign accountability for implementation
- Track implementation progress
- Ensure all Management of Change processes are followed
- Check that the solution is delivering the expected results
Root Cause Analysis is most applicable after equipment has entered service, and tends to be reactive in nature – it is generally only applied after an equipment failure event. While it is a highly valuable tool for encouraging and implementing continuous improvement in reliability performance, there are other tools (such as those mentioned earlier) that are more effective in ensuring that failure events don’t occur in the first place. Nevertheless, all high performing organisations tend to have formal processes in place for Root Cause Analysis and Failure Elimination.
Conclusion
This article has outlined four tools that can be used to improve equipment reliability. We offer training courses that provide more insights into these (as well as other) reliability improvement tools and methodologies:
-
Product on sale
 Root Cause Analysis for Team MembersOriginal price was: $2,150.00.$1,935.00Current price is: $1,935.00.
 -
Product on saleReliability Excellence FundamentalsOriginal price was: $4,795.00.$4,315.50Current price is: $4,315.50.
-
Product on saleRCM & PMO for Team MembersOriginal price was: $2,150.00.$1,935.00Current price is: $1,935.00.
-
Product on saleIntroduction to Reliability ImprovementOriginal price was: $1,075.00.$967.50Current price is: $967.50.


If you would like to receive early notification of publication of future articles, sign up for our newsletter now. In the meantime, if you would like assistance in establishing effective reliability in operations within your organisation, please contact me. I would be delighted to try to assist you.